In this article we give a glimpse of how our modelled probabilities for future real equity returns feed into dynamic asset allocations for the equity component of any Fowler Drew portfolio. This ‘look behind the scenes’ uses the highly-topical example of the UK and US markets. After being the largest allocation in Fowler Drew portfolios for much of the period since 2008, the US is now the lowest, mainly benefiting the UK allocations. Why the switch?
The first point to note is that, as systematic or quantitative investors, we are constantly generating mean real-return projections for each equity market for every time horizon, derived mathematically from the latest observed deviation in cumulative achieved returns from a fitted trend. The return-generating model assumes slow mean reversion. The cumulative return history is shown below for two markets, the US and UK. These two equity markets happen to show very similar long-term performance (capital returns plus income reinvested) when deflated by their own inflation rates. In the chart below (of logarithmic real total returns) the fitted trend (the straight line) for each market’s entire date history is almost identical in slope: 6.1% pa for the UK and 6.2% pa for the US.
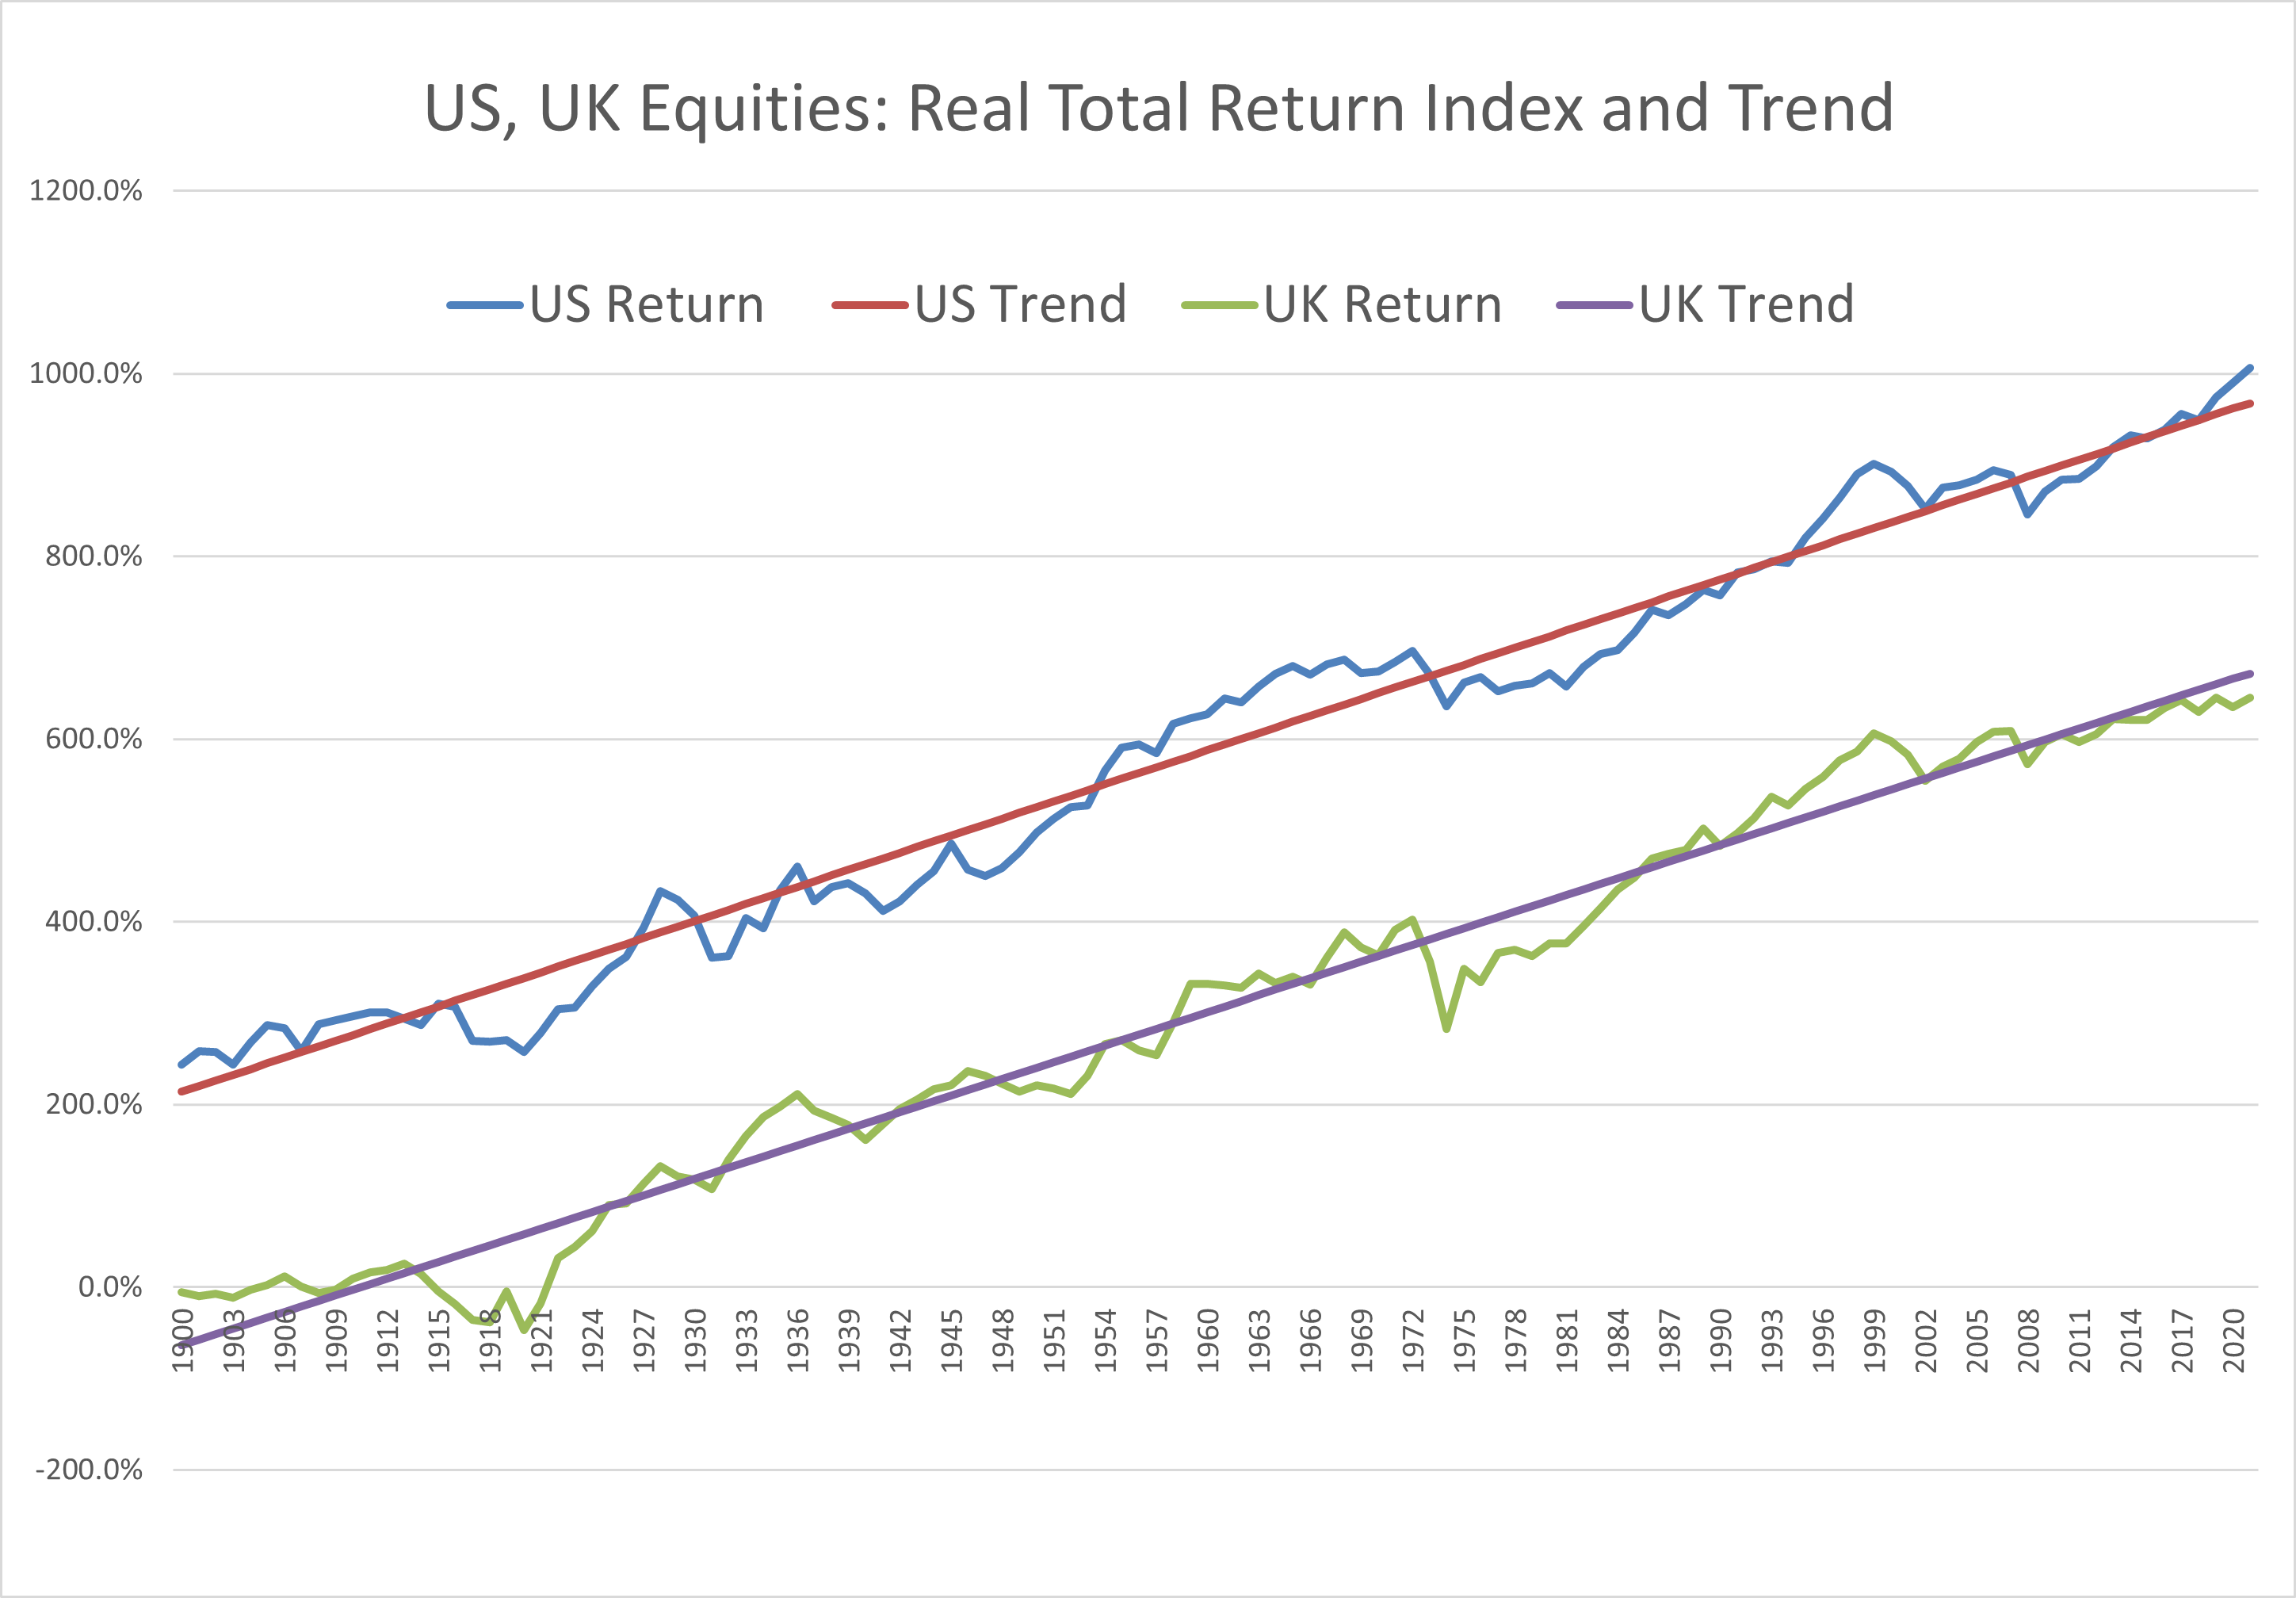
The UK data history (Dimson, Marsh, Staunton) is from 1900 and the US data (from 1871) has been truncated to fit the same period (which is why the starting points on the left axis are different). Of course, over a long enough period, even a differential of 0.1% pa compounds to something significant. But the main point of this approach to the data is to support some general assumptions about the equity return-generating process in public equity markets.
These assumptions are that the process is consistent with an adaptive capitalist system. In positing that a ‘system’ is at work, it is important to note that these data series are both representative indices, designed to reflect the changing mix of companies and sectors making up the public market. It is ‘adaptive’ in that sense, as well as in the persistence of the trend in many different economic environments. Relying on these observations to make projections assumes that the system will remain adaptive and that past trends are the best assumption for future trends. That is implicit in most long-term investment approaches and we simply make it explicit. So the data contains an important message at any point when markets have diverged from each other’s normally similar paths. If mean reversion is a sensible assumption in all markets, mean reversion in relative returns must also be a sensible assumption. The US and UK have diverged.
The US market is currently 40% above its trend whereas the UK market is 26% below its trend. This follows a prolonged period of outperformance by the US compared with most other markets, coupled with general underperformance by the UK, mainly since the Brexit vote. From a neutral investor perspective, these two markets look like outliers. The size of the gap between them is unusual.
For a UK investor, the local-currency implied valuation of the US market could conceivably be offset by an opposite implied valuation for the dollar against sterling. US equities could be overvalued at a time when the dollar is very cheap. However, this is not currently the case. The next chart shows the notional real exchange rate for the dollar against sterling. This is simply a cumulative plot of the nominal exchange rate adjusted monthly by changes in their relative inflation rate. Since nobody knows what the ‘true’ real exchange rate based on theoretical purchasing power parity, this chart is a naive estimate, arrived at by calculating the average of the plots since exchange rates floated in 1969.
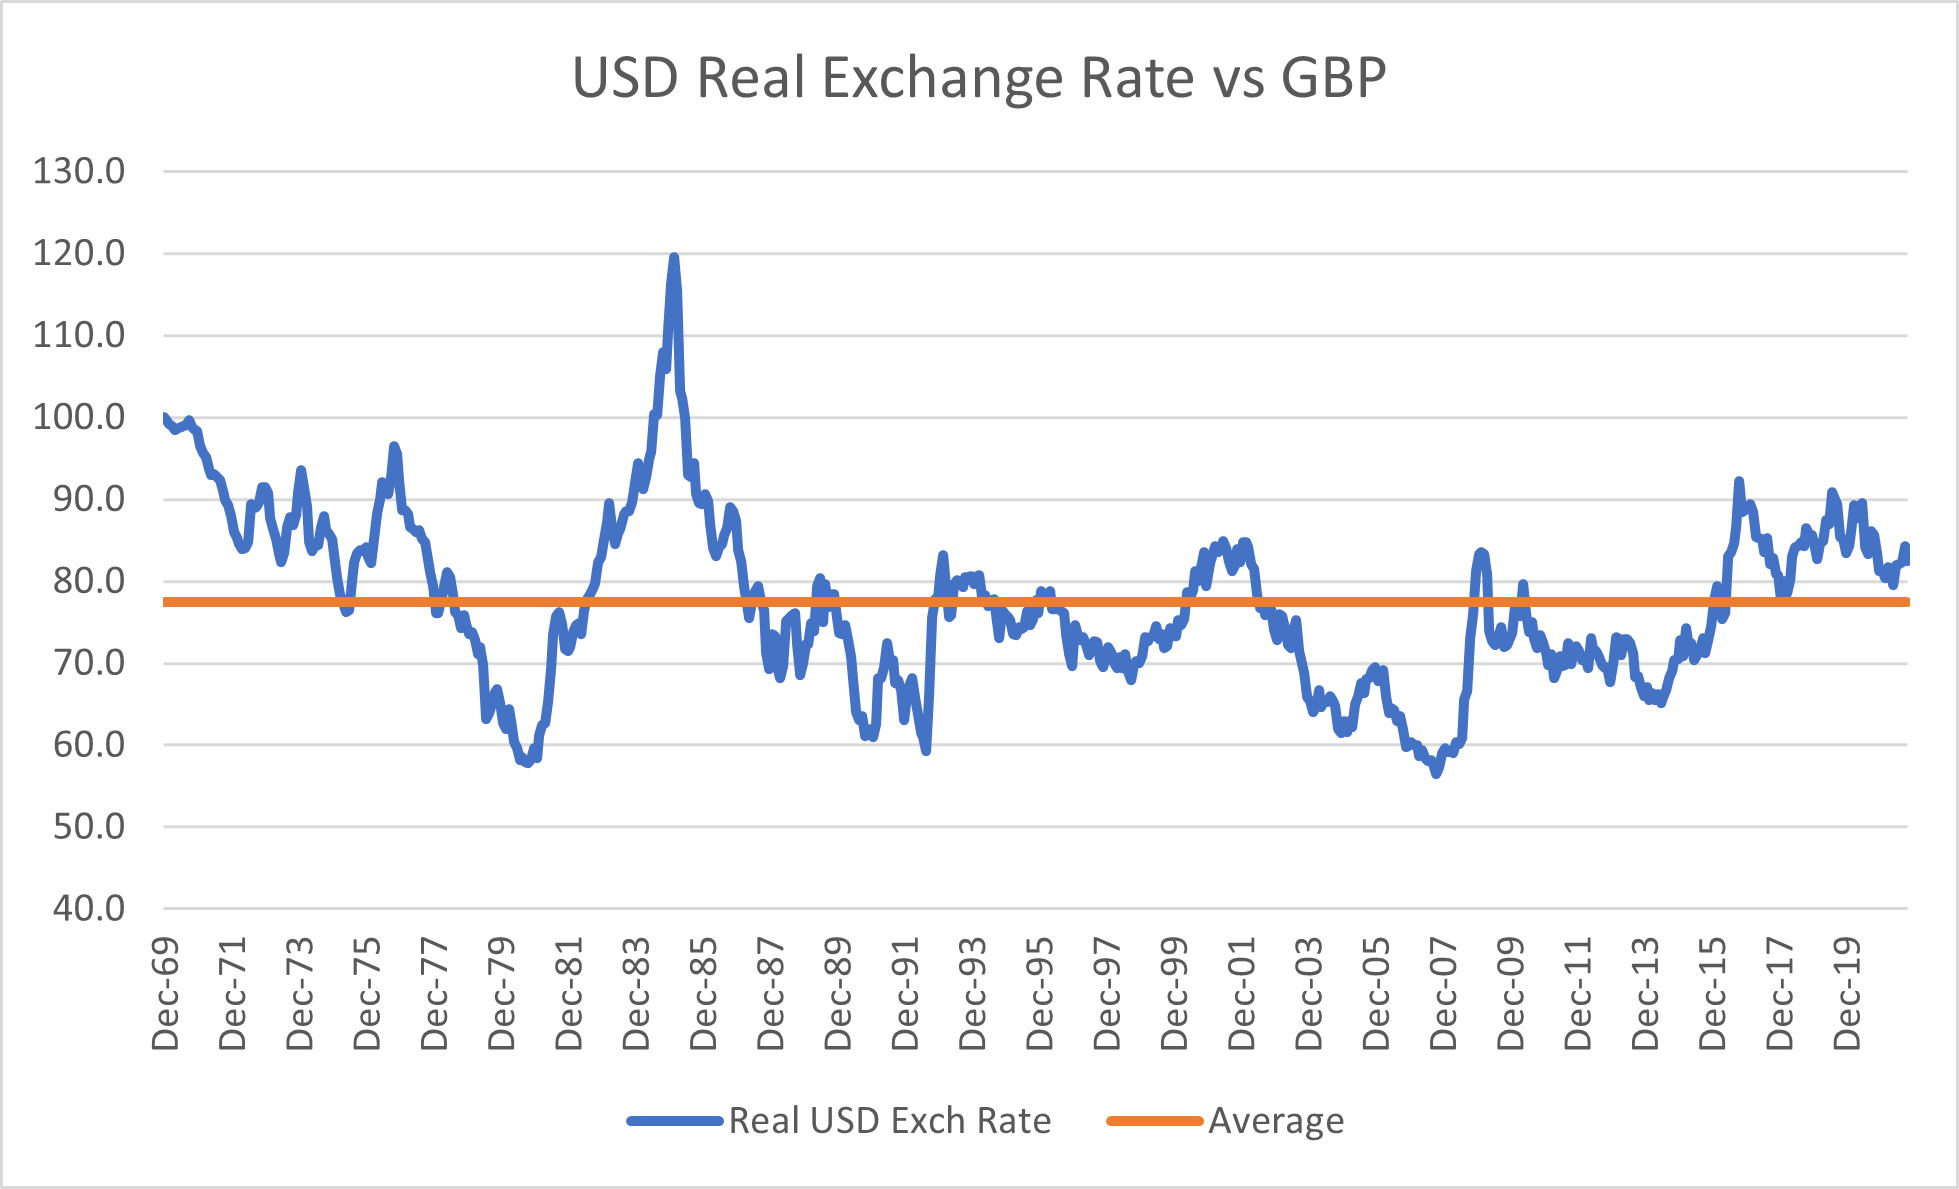
The message here is that there is nothing about the current exchange rate to alter the conclusion that, for a UK investor, UK equities should provide higher sterling-adjusted real returns than the US market. At 15 years, for example, our mean-reverting model has a mean for the UK of 7.1% pa versus 4.3% pa for the US. That compounds to big differences in cumulative returns.
This approach to evaluating both equity markets and currencies is only valid as a basis for forming medium to long-term estimates of future return probabilities. Neither is predictive over the short term. So adopting this as the basis of a contrarian, return-seeking asset-allocation strategy is a luxury for investors who can afford to treat short-term returns as essentially random and unpredictable. That requires there to be no consequences for them of volatility, which in turn means they must be confident they can live with the volatility in order to obtain better expected outcomes over the periods that matter given the nature of the outcomes. You ‘live with’ risk but you ‘live off’ outcomes. For private wealth, ‘outcomes’ are typically real consumption levels at a wide range of time horizons, many being very long. They can be determined from goal-based financial planning.
Even if you were confident the mean expected returns from the UK would, at longer horizons, exceed those provided by US equities, the probability distribution around those returns would not be the same. The first chart visually suggests the degrees of deviation from trend and how long they can last are broadly similar. But exposure to foreign markets also brings currency risk. This is not just in the form of the variance of the nominal exchange rate but also in the form relevant to UK investors’ longer-term real outcomes: the deviations from purchasing power parity observable in the second chart. Though these deviations appear largely independent of the market deviations (the correlations are all over the place), we cannot model them as though they might not, in some simulations, worsen already bad market returns or extend even further good market returns.
So in any portfolio construction process that relies on expected returns and risks, at the time horizons relevant for an individual’s own cash flows or consumption, there will be a strong bias to the UK. If the construction process is also designed to force minimum diversification across different equity markets, that will prevent the process moving everything into the home market. But those diversification constraints need only bite if there are no better markets than the US. Because there are currently other good-value foreign markets to choose from, there is no requirement to enforce any exposure to the US. This is the case today. Emerging markets, Japan and Europe ex UK all offer significantly higher risk-adjusted real returns than the US.
In a Fowler Drew goal-based portfolio, global equity exposure forms the risky-asset component. Of this component, US equity exposure has moved from 29% in December 2008 (in the first chart, the widest gap in the opposite direction) to almost zero now. The home market has gone from 27% in 2008 to 40% now. Most of the switch from the US to the home market was spread over the last few years. It would be nice to say we stuck with US stocks till now and then made one big switch. But the model is by design gradualist. Anything else implies a belief in market timing which is at odds with our view that short-term equity returns are unpredictable.
This article addresses only the process by which we allocate between equity markets. The main form of risk control in a Fowler Drew portfolio involves diluting the equity component with risk free assets, in the form of horizon-matched index linked gilts. This recognises that most private wealth has to meet real, not nominal, needs and wants. We demonstrated this higher-level allocation decision in an earlier article.The message then and now is that equities as a whole are not overvalued but real risk free rates are exceptionally low, creating an expected risk premium for equities that is more often associated with bear markets. This was, of course, the intention of negative real interest rates as a policy instrument. It appears to have worked.