Spending goals and drawdown
For most people satisfying spending needs dominates other purposes for saving so ‘drawdown’ is rightly becoming the new standard for turning savings into spending – and not just for pensions
Let’s talk about spending
The investment management industry is very good at talking about investment returns but terrible at translating these returns into the thing that really matters: spending. Saving is simply deferred spending. The forms of spending derive their relative importance from needs but those needs are also typically dependent on time, or when the deferred spending has to arise in order to deliver satisfaction. A range of personal spending goals for an individual or household, with clearly different timing-dependent need, includes:
- Meeting spending during an interruption to earnings
- Meeting unforeseen lumpy expenditures
- Spreading irregular earnings to meet a more regular spending pattern
- Raising a family
- Spending in retirement when earnings cease or decline
- Gifting – so others do the spending
Though retirement is often promoted as the most important claim on your savings capacity (retirement spending being a need not a luxury), it will not necessarily dominate at every stage of life and the job of an adviser is to understand how you prioritise the various calls on your income. Whatever the purpose and whatever the time horizon, understanding what level of spending the invested capital might support is crucial and that is a job for computer modelling. Assuming some arbitrary level of average return just won’t cut it.
Drawdown: a process of living off capital
Drawdown is a new addition to the jargon of personal finance. But it is a useful one and although generally used in connection with personal pensions, really just describes the process of turning capital (pension or non-pension) into a stream of cash payments.
We are all familiar with the term saving. Savings come from income but as soon as it gets invested we call it capital. When we want to spend it, we convert it back into something we call income but it is really just spending the capital that originated from income. Let’s just think of it as money. Or (since money can take different and possibly contingent forms) we prefer to call it resources.
As long as resources remain invested, or ‘at risk’ in financial markets, even after we ourselves retire, our money doesn’t retire. It keeps working. The product of capital working takes two forms: capital gain or loss; and interest or dividend income. The two combined make up what is known as total return.
So, in a drawdown plan, spending is the output of the plan in which resources assigned to it are at work in financial markets earning a return that has the potential to boost deferred spending.
Though retirement provision is the most common type of drawdown plan, the principles apply equally well to other types of spending goal funded by a capital sum:
- Living off a clean-break divorce settlement
- Living off an injury settlement
- Integrating a Defined Benefit pension transfer into a spending plan
Drawdown changes the conversation
Talking cash amounts after tax
Funding spending requires a stream of cash amounts – after tax. So spending is already a different definition from the product of a portfolio return. Spending needs further assumptions about tax. This will vary significantly depending whether the draw is from a pension account, ISAs or a taxable investment account.
Talking holistic
Spending is not the same as the product of a drawdown portfolio as the latter complements, or sits on top of, any guaranteed income sources such as the State Pension and any final-salary or Defined Benefit pension entitlement. So a drawdown portfolio planned to meet client-chosen spending outcomes and constraints must be holistic, including those contributions to spending. Because they are not subject to uncertainty about outcomes, these guaranteed contributions also affect the optimal risk approach for the drawdown portfolio.
Talking about dates
Spending goals are characterised by multiple time horizons (possibly ranging from immediate to very long). This means the generalised horizons of traditional portfolio management are not optimal.
Talking constraints
They involve constraints such as
- how long the capital must last (based on some assumption about how long the recipients will live) and
- how much the rate of draw can be allowed to fall without intolerable consequences.
Talking in real terms
The outcomes and constraints on outcomes are all expressed in real terms. A decline in spending power caused by inflation has the same impact as a decline caused by bad investment returns while the resources are at work. So the relevant product of risk and time is real total returns.
Talking about the odds
The probability distribution of real total returns, combined with the assumed rate of draw, will determine the range of outcomes, defined as a range of possible sustainable draw. These probabilistic results can be combined with certain or guaranteed real income sources like the State Pension to estimate the range of possible spending that can be used to help the client visualise consequences. It is total spending that you can relate to, not possible investment returns.
What you can do
You can create your own example using the drawdown planner but here’s one we made earlier.
Mr and Mrs X, with 2 adult children, are approaching retirement. The resources available to fund retirement spending are now largely known. They will have a small final-salary pension and two State Pensions plus their own savings. They can visualise fairly clearly their needs and wants.
They want to know:
- Whether they have enough to retire as planned
- How much they can safely spend
- When they can make gifts to their children
- How any decisions which can’t be made now will be made in the future
After collaborative planning, satisfaction could be defined very precisely:
- Spending or gifting as much as they safely could across the whole plan
- Avoiding falling short of a minimum spending level at different stages
- Valuing higher spending most if it arises early in the plan
- Experiencing no greater volatility than they knew they were used to
- Taking no more risk than provided payoffs they valued
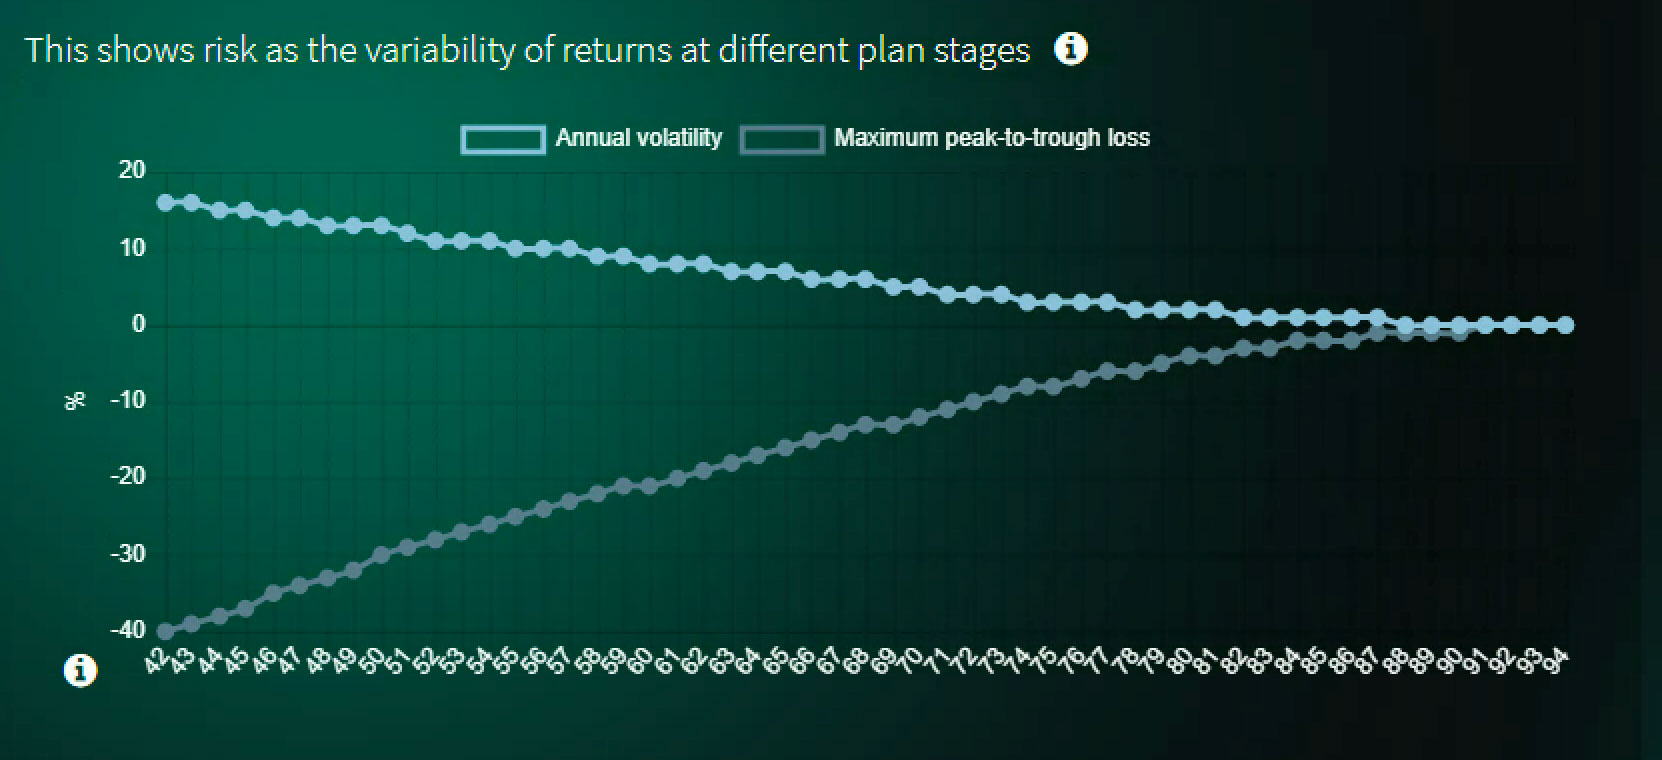
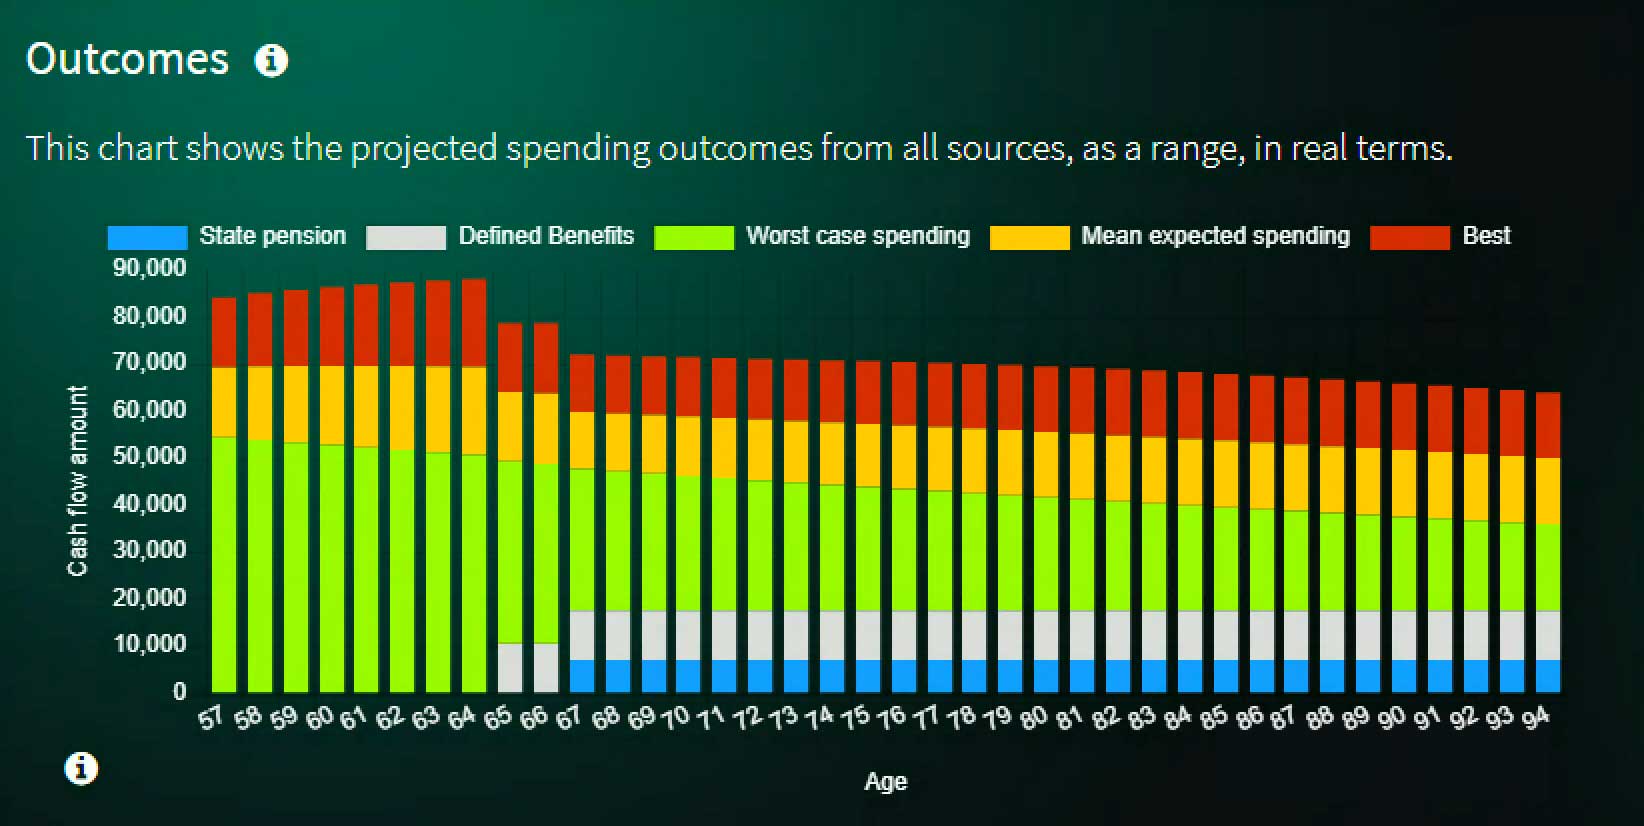
Given the resources available, the ‘right’ risk approach was the one that generated the level and time profile of minimum spending (at 95% confidence), shown below as the top of the green bars, with upside for either own spending or gifting represented by the orange and red areas.
This risk approach would carry with it, early in the plan, a level of short-term volatility from the assets assigned to the drawdown goal they felt was no higher than they were used to. But portfolio volatility would also tend to decline over time as the remaining time horizons shortened, the risk exposures reducing through time. They must reduce because an unchanged level of risk would otherwise lead to a breach of the minimum spending constraint, the range of possible outcomes being partly dependent on time. This dynamic risk profile was illustrated graphically as the changing average for the remaining plan duration.