In a previous article, Whose performance is it anyway?, we addressed the significance of performance, for both clients and the firm, in goal-based wealth management. Our key observation was that when assets are managed to meet client-specified outcomes (or liabilities) within their own tolerances, performance is mainly a product of the choices of the client rather than the firm. In fact, where firm-wide performance matters it means firms are treating performance as a contest and this will interfere with their proper role of helping clients make the best choices for them.
In this article we focus on how outcomes-driven investing should employ benchmarks to explain the contribution of each party to the returns earned in a period.
Benchmarks in goal-based wealth management
FCA rules require discretionary managers like us not just to measure and report each client’s performance in each reporting period (at least quarterly) but also to compare it with ‘an appropriate benchmark’. We do both at the level of the virtual goal-based portfolio as this is what is being managed to deliver the planned outcomes for the goal. What constitutes an ‘appropriate’ benchmark is not defined by the FCA but inappropriate benchmarks are likely to be misleading and often deliberately so.
The FCA also requires us to show ‘a prominent warning that the figures refer to the past and that past performance is not a reliable indicator of future results’. It is possible to reconcile these two observations if benchmarking is seen as part of the accountability of a manager to its client, whatever the information content.
‘Accountability’ means being able to quantify divergences and put them in an appropriate context. We believe that means we need two forms of benchmark for our portfolios, each aiming to identify different things.
- The effects of selecting our generic liability-driven approach (the client’s decision)
- The tactical effects of our own implementation of that approach (our decisions).
Benchmarking our decisions
Performance of every individual spending goal is measured against a customised dynamic benchmark. It is dynamic because it has a time profile for ‘derisking’, replacing equity with risk free assets, based on the shortening duration of the liabilities. As a ‘glide path’, it reflects the individual risk approach for the whole plan. In our modelling the risk approach is constant (unless changed as a plan input along the way) though the risk level (balance between risky and risk free) changes with time, as a function of the duration of the remaining cash flows. The derisking profile assumes time is shortening but market conditions are constant, as if always ‘normal’, defined as in line with each asset’s own historic trend. This is shown below for a sample of ‘drawdown’ portfolios with different cash-flow durations and different risk-aversion levels.
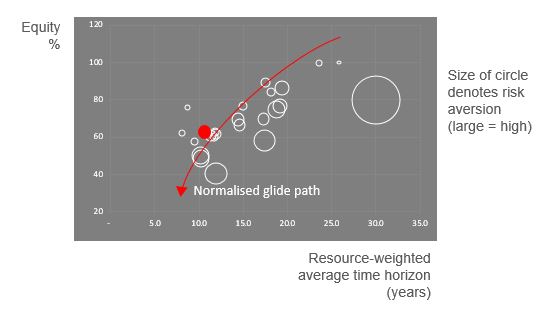
Performance relative to the customised benchmark reflects the positive or negative return effect of our having acted on the deviations in markets and currencies from trend that we observed. In our methodology, deviations from ‘normal’ valuations explain any differences between benchmark and actual weights that aren’t explained by duration. In the exhibit, the red dot marks the equity allocation for the portfolio whose glide path is illustrated. It’s above its path because we calculated that markets were then somewhat undervalued relative to their own history and relative to risk free rates. For that duration, the excess return over the risk free rate (also known as the equity risk premium) was projected to be higher than normal so we should hold a bit more in equities. That difference in equity weight has a difference in return associated with it, for better or worse, and that’s what we want to measure.
Fowler Drew normal weights for equities (assuming observed trends and risk measures) are also used as the benchmark for 100% equity portfolios. Unlike a spending goal, this has no glide path to customise.
Comparisons with the identified Fowler Drew benchmark address the question: have we added tactical value to the strategic approach?
Benchmarking the client’s decision
The client who chose our liability-driven approach could have chosen a more conventional private client service. In that case the portfolio would have been benchmarked to one of several industry-standard indices. Industry benchmarks for ‘balanced’ asset allocations are normally described in terms of the client’s attitude to risk, typically from ‘cautious’ to ‘aggressive’. The risk spectrum they map to is one defined by volatility: the short term ups and downs in prices. They are mapped mainly by the varying exposure to each of equities and conventional bonds. To identify the performance effects of a liability-driven approach, we compare actual performance with the most appropriate industry-standard index. We choose that as if we were applying a conventional approach driven by volatility.
For 100% equity portfolios we don’t use an industry-standard benchmark as these tend to have high exposure to ‘alternative’ assets like hedge funds and property. We benchmark instead against a composite of 50% FTSE All Share and 50% FTSE All World ex UK.
Relative performance revealed by this comparison can be thought of as the ‘opportunity cost’ of adopting a liability-driven rather than a volatility-driven approach. It addresses the question: have we added value by providing this strategic approach?
How do clients actually assess their own decision?
Though we can estimate this notional opportunity cost, there isn’t a lot of practical information in the numbers, even over quite long periods. This doesn’t matter much if in fact the client chooses to focus on what each approach can deliver as benefits that don’t depend on performance. Clients of Fowler Drew believe they are ‘buying’ ease of decision making and confidence that decisions will maximise the satisfaction their wealth can provide.
Our exceptional client retention rate of 99% is not due to performance, good though it has been. Even 17 years of delivering the service (for the earliest clients) represents only a fraction of their life plan. But it is far longer than necessary to judge the value of the plan and our role in enabling it.