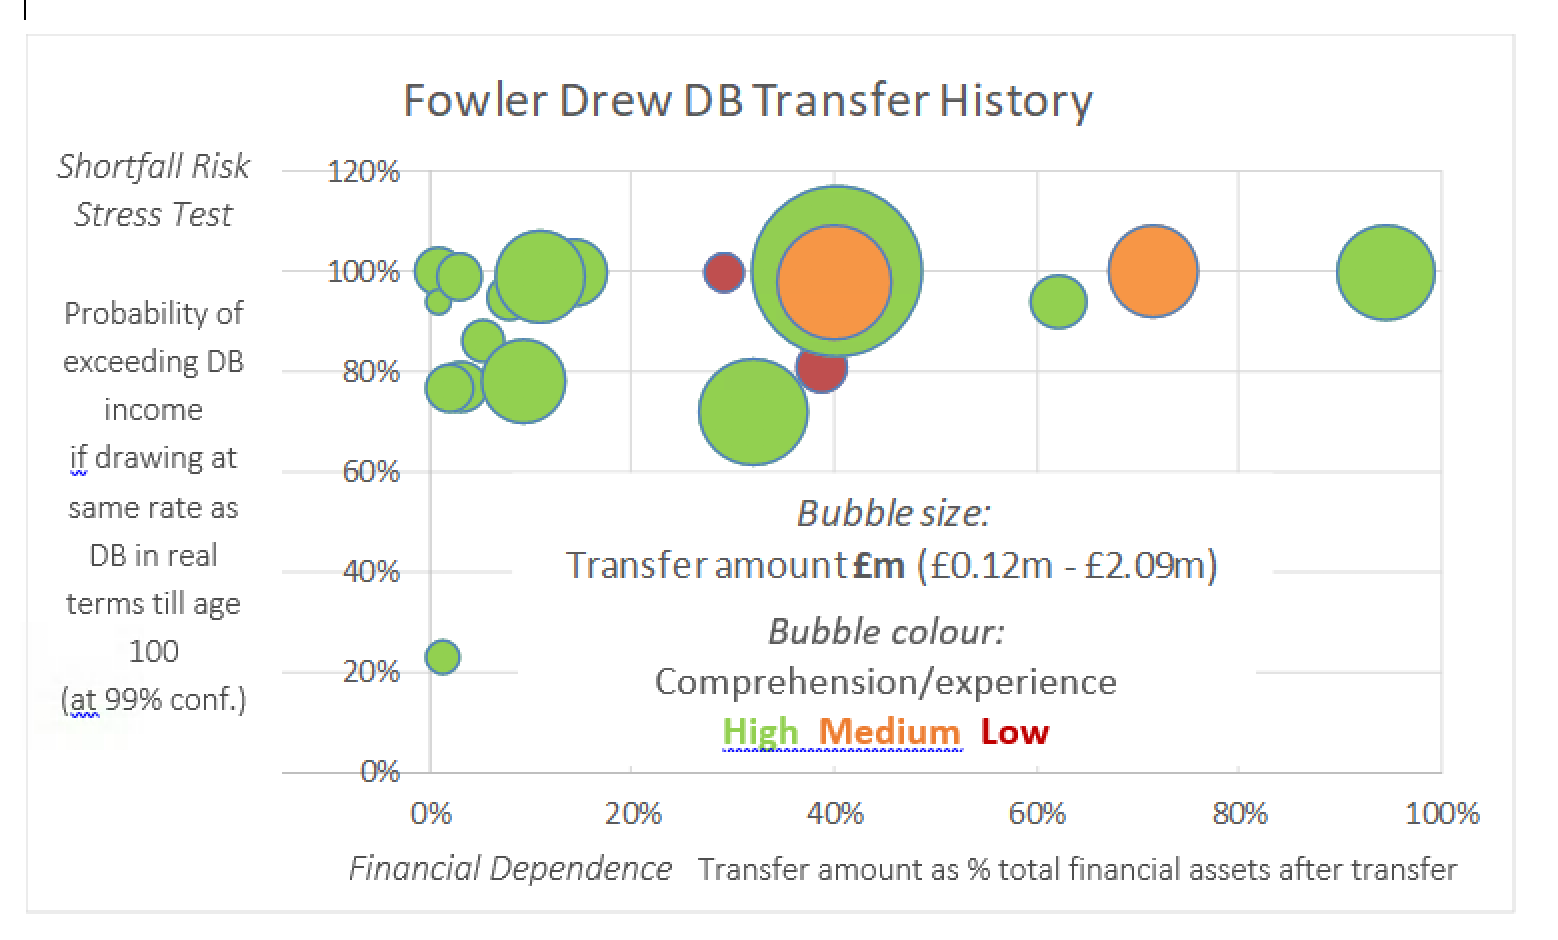
The scale of our transfer activity is not typical (just 19 transfers in 2 years) but the transfer logic and the numbers applicable to it are perfectly representative. The data is a direct challenge to critics of transfers in principle, or even in general, derived as it is from systematic rules for testing ‘utility’ or welfare changes and based as it is on robust stochastic modelling.
The data was originally prepared in anticipation of the detail the FCA would request as part of its market-wide investigation of DB transfers. The fact that the eventual requested data did not make the distinctions we thought were important was disappointing but no surprise.
At our initiative we then put the data together in a report to inform our Professional Indemnity insurers, Liberty, from whom we are still waiting for a quote to cover business written before the increase effective 1st April 2019 in FOS awards from £150,000 to £350,000 (a change which is in fact entirely logical). Meanwhile we have no cover for any new business. We are essentially frozen out of this activity. Worse, a Catch 22 applies: FCA guidance means we can’t simply ‘assume’ any DB rights in a client’s holistic retirement plan without a full advice process yet we can’t provide that process without insurance cover.
DB transfers are clearly not a significant business line (it has mostly served existing or new wealth management clients) but we care about the impact on consumers shut out of this opportunity and we also care about the unfortunate precedent of regulation calculated to prevent an activity indirectly. With a reasonable PI premium we will be back in the market, confident any transfer we carry out will generate demonstrably better outcomes for our clients, as long as the conditions creating the opportunity persist.
From our data history we have extracted four key measures, plotted below.

1. The key measure of economic gain in ‘outcomes’ (sustainable real spending) is upside relative to shortfall risk. Since upside motivation varies by individuals, we have only shown our downside risk ‘stress test’ but we note the unweighted mean increase in sustainable real income at 50% confidence was 48%. The stress test is the probability of achieving or exceeding the same real income by drawdown, where this is calculated by simulating the outcomes of a real draw at the same rate as the DB income at the 99% confidence level, on the basis of drawing till age 100. (As we explain in the note for Liberty, this is so dire that arguably not even notionally risk-free structures would survive in the same circumstances.)
2. This is plotted against a dependency ratio: the proportion the transfer amount represents of the total financial assets available to support retirement spending. This varies by range (if not distribution) for our clients much as for the population as a whole, even though our clients’ absolute wealth is well above average, because the relative size is mainly a function of randomly-distributed past years of accrual in former employment and age now.
3. The third dimension is the experience level of our clients, which is probably above average because of their wealth levels, but includes spouses as well as individuals with less familiarity with financial concepts.
4. Finally we measure the absolute size of transfer whose range is, we believe, fairly representative of the population, again because years of service as well as salary levels vary so widely.
Given the way Cash Equivalent Transfer Values have to be calculated, the origin of the welfare gain from transfer is not just low or negative real risk free discount rates but also the move by many schemes to holding risk free assets rather than equities. When schemes and individuals held broadly the same ‘balanced’ asset mix, there was no scope to arbitrage between DB and DC. This is why we retained DB rights as an underpin to our clients’ spending plans until 2016, even though we had the permissions required to carry out transfers. Though the schemes we later transferred from are mainly ones that have both ‘derisked’ and plugged any funding shortfalls, this is sufficiently widespread across schemes today to make the exceptional trade off between upside and shortfall risk relatively common across the population. It even describes, for instance, the British Steel Pension Scheme.
In 2016 we called the DB transfer opportunity the closest we have seen to a ‘free lunch’: not riskless but as low risk as is possible even for people with low risk capacity or appetite. It is not an arbitrage created solely by market conditions, which of course preclude free lunches, but arises mainly from non-market interventions in the funding of DB pension promises, both regulatory and accounting. As we pointed out to Liberty, if we ignored this opportunity, our clients should sue us.