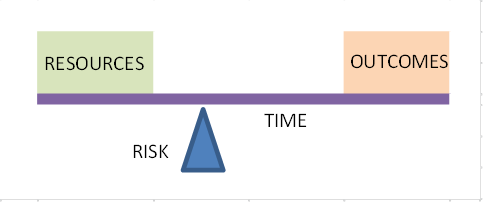
New consumer research shows 79% of retirees want a guaranteed income for life but only 10% expect to buy an annuity. An annuity guarantees an income for life. Is this plain ignorance or a general unresolved skittishness? We plump for skittishness. And we think it persists because we aren’t focusing enough on what guaranteeing income costs, in terms of capital required or spending foregone. We aren’t facing up to the hard-coded relationship between the four variables shown in the diagram: resources, time, risk and outcomes.
The research was conducted by Opinium for private-client stockbrokers Tilney via an online survey in April. It looked at the attitudes of 1,293 nationally representative UK adults (aged 18+) who had at least one workplace pension. If people know that only an annuity provides the guarantee of a fixed rate of income for life, why are they expecting to choose drawdown over annuities? The actual data since the Pension Freedoms supports the survey evidence: new pension annuity business has collapsed to the point where insurers might as well close the books and/or sell on.
There is however one very common aspect of ignorance which is ‘money illusion’. This refers to mistaking a guaranteed nominal income for life (i.e. fixed in money terms at say £2,000 per month) for a real income with constant purchasing power (£2,000 indexed to inflation). So when most people did select an annuity they almost universally chose the ‘level’ nominal annuity even though the purchasing power was not fixed: it would decline year to year in line with each year’s inflation. So whilst the annuity dealt with the ‘longevity risk’ inherent in self-financed retirement, or how long the income needs to last as a function of how long you live, it did not deal with inflation risk.
If not another example of widespread money illusion, it could only be rationalised because people believed the rate of decline in real spending implied by a level annuity was both relatively predictable and readily tolerable – perhaps because most people value spending more early in retirement and can better tolerate lower spending the older they are. If, that is, they had discretionary spending they could afford to trim, which is not the case for all. Those with a cushion of discretionary spending were the ones least likely to buy an annuity, having better access to the financial advice that would steer them away from buying a level annuity by default or from buying an inflation-indexed annuity because it cost a fortune.
Clients of financial advisers may also be the kind of people who get the concept that guaranteeing income for the whole of retirement is equivalent to forcing capital to retire (from its day job of generating returns from bearing risk) at the same age as its owner retires. Capital does not have the utility that labour has: it can work with unchanged productivity as long as you need it to, without complaining of aches and pains. Separating the working span of labour and capital is what drawdown does.
That said, there is clearly an element of changing work/life balance in the drawdown portfolio, because it will typically be made up of a mix of nominally low-risk ‘bonds’ or fixed-income funds and equities and the mix will tend to change in favour of bonds versus equities as the draw continues. In fact, by the time an annuity used to be effectively an enforced option, at age 75, the preference would probably have been to hold a portfolio largely made up by then of the same bonds that an annuity company might hold. Arguably this is the point at which, absent any bequest motive, laying off the longevity risk makes perfect sense because there is little or no trade off, given the asset mix, in terms of higher potential income.
At Fowler Drew we take a different approach to the management of risk, and the asset mix, during drawdown. It is both consistent with the schematic and uses numbers for each variable to help people exhibit their ‘true’ preferences. It is, as we say, costed.
We divide the plan into a series of time slices, usually of one year each. Each date-stamped time slice has its own resources requirement,to provide a given tolerable range of possible outcomes, in terms of real spending for that year. The risk approach governs the size of the tolerable range. It will usually be subject to some minimum tolerable outcome, both as a fixed real level appropriate to any age-related preferences for spending and as a change from earlier years, so spending adjustments are always no greater than planned. The resource requirement and range of tolerable outcomes then dictate the asset mix for each horizon. In practice, that means you can’t bet next year’s housekeeping in the equity market – or maybe even the next 7 years of housekeeping (or, at some higher level of risk tolerance, 10 years). What you hold instead, to control the range of outcomes, is a an asset that is effectively the same as an insurer would hold to match a temporary annuity: i.e. one that provides a guaranteed income not for life but for a certain number of years, like 7 or 10. This might be cash for near horizons and index linked gilts for somewhat longer horizons where inflation risk also needs to be controlled. Everything else is capital at work, at risk, in globally-diversified equity markets, using index trackers.
Where a conventional portfolio holds nominal bonds throughout, which you might think of as a ‘horizontal’ organisation of the asset mix that changes relatively little, and is optimised on annual volatility, ours is a ‘vertical’ organisation of the mix, by time, which is highly dynamic and differs as a function of age, risk tolerance and market conditions, optimised on outcomes but subject to volatility ‘reality checks’.
Why wouldn’t this also be prone to the investor skittishness observed in the Tilney survey? The key difference is because it is costed. Quantifying the resources requirement for a specified range of possible real spending outcomes at every age, subject to individual preferences for minimum spending and minimum cuts year to year, together with tolerable volatility, makes the trade off between retiring capital and keeping it at work perfectly clear, at every stage. It’s clear because the outputs are ones you can relate to (resources assigned and spending outcomes) – as long as you can visualise the future in terms of the satisfaction that more or less spending (or gifting) can provide. It also assumes people can differentiate between, and prioritise, long-term outcomes and short-term volatility. We have yet to meet a client who can’t relate to spending and consequently make that risk differentiation.