Short-term forecasts may be futile but investors can’t avoid long-term return assumptions. Our model is projecting 20-year real total returns of around 7% pa for a spread of global equity markets. Rather than lower than the historic investment growth trends, in most markets it is somewhat higher. In light of the two key determinants – the starting point of today’s level of markets and the popular narrative that economic growth will be slower than historically – we ask: does this stand to reason?
Why 20 years
Though our model generates return probabilities for all horizons, 20 years is significant in explaining the greatest impact that secular changes in returns have on individual investors’ plans. It arises when there is a sustained run of either very good or very bad returns that applies to a significant proportion of either the saving phase or the withdrawal phase of a saver’s spending plan. Runs can exceptionally last as long as 20 years. In simulations of very long-lived portfolios such as retirement or living off a settlement, where outcomes are measured as sustainable real spending supported by the portfolio, these runs are the outliers. Where the client sets a constraint on the worst tolerable outcome, say to meet non-discretionary spending needs, a long, bad run is the relevant stress test of whether that constraint will be breached.
Our projections
Even over an investment term as long as 20 years, the starting level of markets in the forecast matters. In the Fowler Drew model, the relevant starting point is the latest plot of the ratio of the cumulative real total return of the market index to its own regression-based trend, for as long a history as we can acquire reliable, representative data for. ‘Real’ means the return series has been deflated by local inflation and ‘total’ means dividends are reinvested: there is no draw. What this return series looks like for the UK is shown below. (Data: FTSE All Share from April 1962 and Dimson, Marsh and Staunton before.)
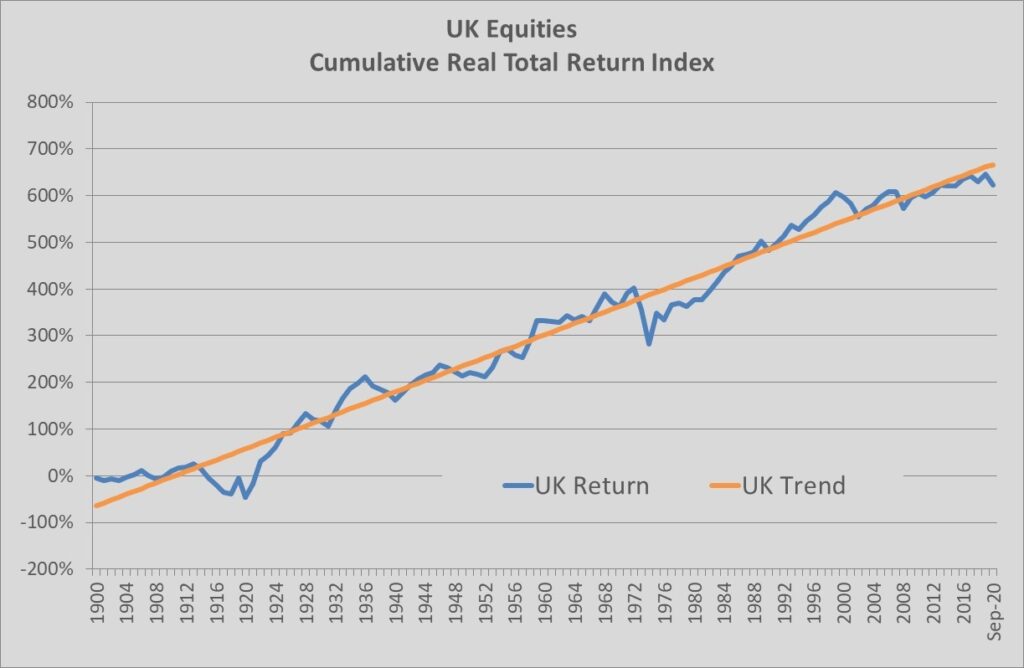
The slope of the whole-history regression trend (orange) is 6.1% pa. Assuming slow mean reversion to an unchanged trend, with the same statistical characteristics as historically, the mean projected real return is 7.6% pa. It is higher than trend because the cumulative return index (blue) is currently below its trend. A starting point below trend would, in a perfectly-informed market, validate expectations of a lower trend in the future. A ‘naive’ forecast, in the sense of not needing judgement, would ignore investor forecasts and assume the trend will persist and instead adjust the implied return forecast up or down according to the starting deviation from trend. That’s what we do, because markets are not perfectly informed and investors make mistakes, particularly emotional ones.
Other major markets also stand somewhat below their long-term return trends, so our projected returns are also higher than in the past. The exception is the US market which has a projected mean return of 5.6% pa versus a trend of 6.2% pa. These are shown below.
The mean of the equity projections (blue), together with the trend (orange), are shown in the top panel for the six geographical regions that are in our portfolio opportunity set. These are all in local currency. In the bottom panel we show the mean expected addition or subtraction to returns due to currency exposure. This comes from modelling pair-wise real exchange rates, also over 20 years, based on reversion of the current deviations from post-1969 average inflation-adjusted exchange rates for each currency relative to sterling. This, therefore, is also a naive measure of expected returns. The chart does not show the observed trends but (consistent with purchasing power parity theory) these are now, after 50 years of floating exchange rates, not significantly different from zero. The annualised losses against sterling appear small over a 20-year period but mean reversion occurs about twice as fast in real exchange rates than in real equity returns so the nearer effects are likely to be much larger.
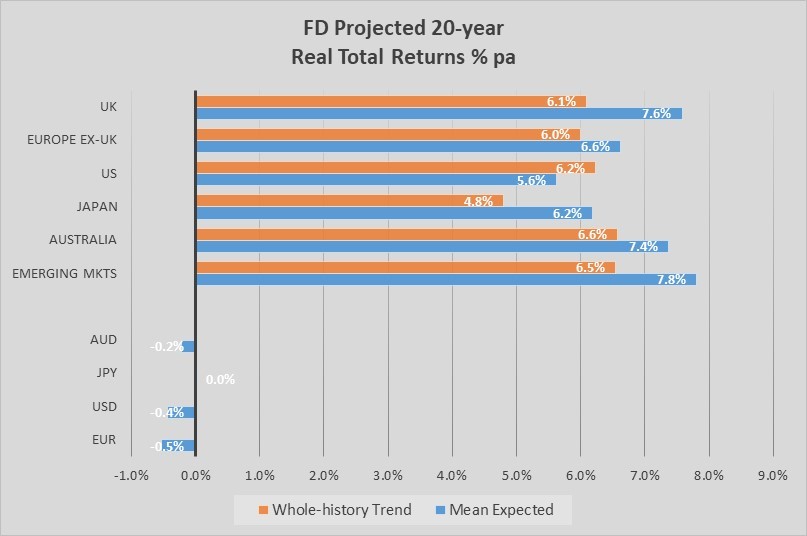
It is not surprising, in light of Brexit, that the UK is almost the cheapest market, slightly behind emerging markets, and sterling the cheapest currency. On a risk-adjusted basis, the margin is even more favourable to the UK but it is the raw, not risk-adjusted, returns that tell us if there is a big gap between our model and the popular narrative. Poorer economic growth or lower returns are clearly to some extent built into markets. This is not true of the US although neither is the US market implying growth much above its past rate. This is contrary to many commentators’ views that it is significantly overvalued: that should show up in a far higher ratio of its observed trend. It is fair to say none of these markets is particularly far from ‘normal’, given that the valuation range at peaks and troughs is as wide as twice trend to half trend.
The popular narrative
Intelligent speculation, based on qualitative commentaries as well as (where available) quantitative forecasts, is that the next 20 years will be tough for the global economy and investment markets. This is based on discontinuities in a number of real forces that shaped the last two or three decades:
- the row-back of globalisation
- the slowing growth of the global working population and worsening dependency ratio with ageing
- the high indebtedness of both business and government as a response to the last banking crisis
- the compounding effects on debt of the unprecedented policy response to coronavirus.
Qualitative commentaries, if not actual forecasts, recognise a number of possible mitigating effects of these changes on the impacts for business as well as economic performance more generally:
- technology adoption
- fossil fuel substitution
- other productivity factors
- the contribution of still-growing workforce populations in some less-developed economies.
As a narrative for investors, these changes are widely seen as implying an unhappy combination:
- Lower real investment returns (independent of inflation)
- Higher and less stable inflation.
Equity return projections
Outcomes versus expectations for real returns from equities will depend on the ability of companies in any one country to adapt to, or even exploit, global headwinds and so might be expected to be particularly sensitive to the mitigating factors. This makes any generalised assumption hazardous, particularly where markets appear to be discounting lower return potential already. It is far from obvious to us that the forces identified as part of the popular narrative will be much greater than is implicit in starting levels for markets other than the US.
In the UK one set of influential quantitative return assumptions is the FCA’s prescribed ‘growth rates’. These are a set of generalised, long-term, nominal return and inflation assumptions that must be applied by retail investment product manufacturers to any illustrations of future returns, based on the asset classes invested in (the same applies to advisers recommending these products but not to discretionary managers like us). That gap at present is between our mean real return of about 7% pa and an FCA prescribed real rate for equities of 5% pa (both before costs). Compounded over long investment periods, this is a large gap.
The FCA rates are heavily influenced by the reviews it commissions irregularly from consultants PWC, usually in reaction to large market or economic changes. The rates adopted unchanged by the FCA since the credit crisis are a clear case of focusing on the slow-growth narrative without allowing for changing market levels and implied discounting.
For PWC or anyone else, lower return expectations may also reflect a second category error: not recognising the disconnect between economic forces and real equity returns. For judgement-based forecasters, it is tempting to focus on the top-down effects of whatever forces are strong enough to explain GDP patterns or global trade volumes, as (for instance) in our summary. These are assumed to filter down to the top line of revenues for listed companies in the local stock market and then to their earnings per share, valuation metrics, prices and so to returns. However, the actual outcomes for real returns are more likely to be explained by two things: starting valuations at the point of the forecast and how well or badly firms adjusted to the changes in inflation and real forces that actually emerged. Errors arise from: misinterpreting what expectations are built in; what forces actually arise and how companies adapted. But there is a further source of error: the constituents of any market index will, over a period as long as 20 years, change significantly if the forces for change, even allowing for a degree of adaptation by existing firms, are strong.
PWC have only ever reflected the popular narrative at the time, always heavily influenced by recent experience. In fact, the decade since the credit crisis saw much stronger real returns than PWC advised the FCA to adopt, even though the assumptions about the top-line forces proved broadly accurate. They were not alone. The biggest errors in expectations turned out to be in the USA and Japan. The second is the more illustrative of our point because the anticipated forces turned out to be accurate yet there were many mitigating trends between the economy and companies listed in Japan that defied the forecasts. Most notable were technology adoption, offshoring of manufacturing and (partly as a consequence of those) less wasteful capital investment, all of which were possibly influenced by a more Western focus on capital efficiency, better corporate governance and the importance of dividends. The actual returns were not as high as the mean of our projections but far higher than most forecasts. Our naive forecasts for the US, which because of low expectations led to high exposure in our portfolios, were also proved right.
Of the mitigating forces we have identified above, one of the most important for the process of both adaptation and new capital formation is technology. This is not just a wild card in terms of the global top-line averages like economic growth and inflation rates. It is also critical to the way real returns behave for any index that is dynamically adjusting to changes in the market value of individual firms. The second means the investor impact for those choosing trackers is not how well the same companies are impacted by technology, as victims or winners, but rather the net win for public companies, including those not yet in the index or possibly not yet even formed. Even if they are already index constituents, the returns achieved may be explained by shares issued in the future that do not exist today. We can add that as a third category error.
The narrative and inflation
The forces we have listed appear to be highly significant for inflation, after decades of low inflation, and therefore for real returns from (nominally) fixed-coupon bonds. This is not being discounted in current yields for long-dated bonds, possibly because the initial effects are expected to be quite benign. Slower growth and higher inflation are not a good combination.
This is critically important for the asset-management industry generally and existentially important for many individual firms. This is because conventional portfolios rely on two assumptions about risk management: first, that the key metric is return volatility or the variance in the path of nominal prices and, second, that the most important tool for managing variance is to combine equities and nominal bonds (or fixed-interest investments). Bonds, then, are the Achilles heel of conventional portfolios, gambling on both future inflation and low or negative correlations with other asset returns and concealing the importance for savers of cumulative real outcomes rather than volatility.
This does not apply to Fowler Drew outcomes-driven portfolios. First, inflation is not highly relevant to our model because we built it directly in real terms, from observed deflated returns (we did this specifically to avoid having to model inflation itself, this being one of the hardest things in economics and the weak link in most investment assumptions). Second, we limit the risk free assets in our asset allocations to either cash or index linked gilts (ILGs) and our risky assets to equities. The job of risk control is then the mix (for each horizon) of uncertain real equity returns with certain real risk free returns. If the risk free ‘hedges’ were matched to all the durations of the liabilities, potentially from one to 65 years away, we would still be exposed to real interest rate risk that might itself be highly sensitive to unanticipated inflation. But since the allocations are divided by time, with short-duration liabilities being hedged and longer liabilities backed by equities, the exposure is only via future ILG yields each time we come to de-risk a proportion.
Let’s explore the expected discontinuity in the factors that have led to benign inflation. The most important driver of disinflation was the break-down of the labour and energy cartels that had dominated the 1970s and 1980s. The energy version was probably the least sustainable, calling for a high degree of cohesion between competing national producers with very different production costs and reserve lives. Labour bargaining power was transformed both by direct intervention in its enabling legal structures and the emergence of new labour pools, particularly China. Offshoring of production, whoever owned it, often united two disinflationary forces: cheap labour and green-field adoption of technology.
Globalisation is not going into reverse because of demographics, yet. Even a 20-year forecast has to allow for the very slow changes in predictable working populations and dependency ratios (how many young and old relative to those of working age). Over that time scale, it may be important how well many less-developed countries, in Africa, South America and India too, meet their opportunities. They may not be so well-organised to displace high-cost labour in more developed economies so the replacement of China as a disinflationary force is a tall order. Hence the general expectation that labour costs globally will be far less effectively suppressed.
In terms of factor costs, energy is much less important than labour. What is in most people’s crystal balls is a mix of inflationary and disinflationary forces fighting for dominance against the background of fossil-fuel substitution. The politics are likely to require energy producers and companies that are heavy consumers to account for externalities associated with fossil fuels and that should tend to increase prices. (Professor Dieter Helm has set out some principles of accounting for externalities in his book Natural Capital: Valuing our Planet but it will clearly take a highly technical international approach to devise actual accounting rules.) Over the longer term, disinflation will probably win out as a consequence of harvesting sunlight. If over the next two decades the main contribution of energy pricing to total inflation is to create instability, that will not be such a change.
From a monetarist viewpoint, factor costs are not as relevant as whether or not monetary policy validates changes in them. Here the story is dominated by the deterioration in governments’ financial position as a consequence of past monetary responses to the banking crisis playing out between 2008 and 2012, as subsequently exacerbated by the policy response to coronavirus. Both phases have involved substantial growth in central bank balance sheets in place of investor funding of deficits. This is not unprecedented but only in times of war and never, as in the case of the coronavirus response, as such a calculated, unforced risk.
The temptation to devalue the debt by allowing inflation to rise is widely recognised by economists and market commentators. It has after all usually been part of the mix in the past for reducing the debt burden. However, we should note that this is not a forecast implied by current government bond prices, even at long maturities. If investors are willing to tolerate real returns on bonds of around zero, the implied inflation rate is about 1-2%, close to targets.
There are, however, some qualitative forecasts of much higher inflation. For instance, economists Charles Goodhart and Manoj Pradham’s recent book suggests 5-10% inflation emerging quite rapidly. They air some of the same arguments as above but chose to pick out the slowest-burner in their title: The Great Demographic Reversal: Ageing Societies, Waning Inequality, and an Inflation Revival.
Some proponents of higher inflation also think it will be preceded by a phase of weak prices due to the lingering effects of the debt overhang and expected weak demand after the pandemic. Betting on the exact time profile of changes in the force of inflation may be one of the factors supporting bond prices at present. But it is also possible yields do not even imply forecasts if, as in the UK gilt market, prices may be set by institutions hedging long-term liabilities and so indifferent to expected real yields.
In conclusion, speculation about lower real equity returns has little or nothing to offer versus a naive forecast. But a change in the inflation regime cannot be dismissed as wrong and threatens not just the implied forecasts for real returns from bonds but the entire premise of ‘balanced’ management.