Cost comparisons for 25 UK wealth management firms submitting data to FT Money in June 2021 imply that, at all portfolio sizes above Fowler Drew’s minimum amount, our annual management fee, plus platform or custody costs, is significantly below the average. These cost savings significantly shift the odds in favour of you doing far better than the industry with your money, which is how it should be.
The FT survey respondents look reasonably representative, with many of the market leaders included as well as a number of smaller firms. We were not invited to submit data. To measure averages for fees, which is what we are interested in, we have excluded firms that did not provide fee data and we also excluded one online firm as not representative. We have shown data in the table only at a portfolio size of £500,000 and higher, to allow fairer comparison with our own business.
The fee data collected by the FT does not include product costs. These costs vary between firms that build portfolios with securities (more likely to be integrated wealth managers) and firms using funds (their own or third parties’). Increasingly, even integrated firms like UK stockbrokers invest private wealth through funds rather than individual securities. For all firms using funds, the main cost difference arises between those using actively-managed funds and those investing mainly or entirely through low-cost passive or index-tracking funds. This generic difference means all-in cost comparisons are not necessarily a pure measure of cost competitiveness. It is therefore probably helpful to ignore product costs for the purposes of identifying the range of costs between firms that are otherwise broadly comparable.
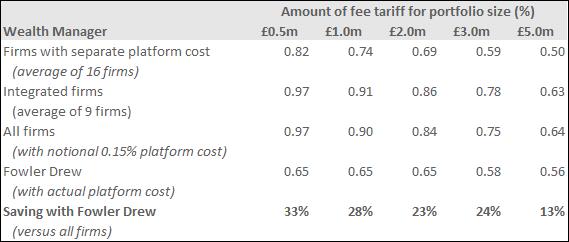
One adjustment is necessary to the submitted fee data. To make the firms reliant on platforms (as we are) comparable with integrated firms (who say they provide their own bundled custody and transaction functions), we have added a notional 0.15% pa for platform costs. These probably vary in fact between 0.15% and 0.30% but with differing sensitivity to scale of assets on the platform, or different treatment of spouse portfolios. So our adjustment of 0.15% is relatively generous, but mainly at the lower end.
On this more comparable basis, the average cost for all firms in the survey is 0.97% pa at a portfolio size of £500,000, falling to 0.64% at £5m.
Combining our flat fee rate of 0.5% of assets (up to £7m), with actual platform costs, the savings when retaining Fowler Drew are between 33% at the lower end and 13% at £5m.
If we assume the generic preference for passive over active adds further savings of 0.5% pa (on the basis the average incremental return across all firms is zero so product costs alone explain the average difference), we might present the all-in savings as between 45% and 50%.
The absolute cost difference ranges between 0.85% pa at £500,000 and 0.63% pa at £5m. The first is probably more representative of the compounding damage to outcomes for someone building retirement savings over their working life. A difference of 0.63% is perhaps more typical of the cost drag on spending outcomes for a retiree with substantial sums accumulated by the time they start drawing down.
These typical cost levels are simply irrational. The best expectation is there will be no selection ‘alpha’ generated (which for the industry as a whole must be true) and so if we assume 5% pa as a reasonable estimate of market returns (with moderate risk taking) before costs, the industry’s all-in charge at the lower end of portfolio size of 1.7% amounts to one third of the expected real-return driver for the investment plan. With less risk, the ‘cost wedge’ becomes even higher as expected market real returns for a lower-risk portfolio will be lower. And if we split the market return into a risk free component and a risky component, the cost wedge can easily represent more than half the reward for risk, or excess return. The industry takes half the reward for bearing the risk yet bears none of it.
Even at the high end, where regressive fee scales apply, the cost wedge might amount to more than a quarter of the gross return and 40% of the excess return.
For most investors, charges will erode the benefits from their wealth more than tax will.
Our analysis here is as objective as we can be but the comparisons with our own costs are obviously self-serving. We have chosen to operate with a much lower cost wedge. You can read more about how we charge and how much we charge here.
The argument that you can eliminate many industry costs without losing anything of value, which is what we enable for our clients, is made here. The video breaks down the different activities that make up the service of a typical, active wealth manager and demonstrates which you need and which you don’t. Wise investing involves cutting out the expensive activities that deliver little value and are highly unpredictable.
How else do we achieve our cost savings, so we can operate at the thin end of the cost wedge? Mainly by using systematic, quantitative decision processes. But as you will see from the testimonials throughout the site, clients see the benefit not so much in terms of cost savings as in gains in welfare: more objectivity and less wealth-destroying emotion. That translates into more composure as well as better outcomes.
Our sensible costs are built into the free-to-use Planner on our website as well as into all our goal-based portfolio modelling. To get the outcomes modelled by the Planner, you will need to stop paying typical industry charges.